


No items found.
Content of
Osteoarthritis PowerPoint Infographics
Infographic 1: What You Need to Know about Osteoarthritis

- This infographic focuses on osteoarthritis, the most common type of arthritis.
- Typically affecting individuals in their late 40s to mid-50s.
- It contains an image of a woman, highlighting that women are more likely to be affected than men.
- Common areas of impact include the knees, hips, and hands, with symptoms such as joint pain, stiffness, and, in some cases, a scraping sound in the knees.
- The infographic also notes the potential for spinal stenosis to develop in the spine.
Infographic 2: Osteoarthritis Risk Factors & Complications

- This infographic provides information about osteoarthritis, a degenerative joint disease caused by the breakdown of cartilage within joints.
- It highlights various risk factors for developing osteoarthritis, including age, obesity, previous injuries, poor posture, and stress.
- The infographic also outlines potential complications associated with osteoarthritis, such as reduced productivity due to chronic joint pain, weight gain due to decreased physical activity, and anxiety or depression related to the pain and its impact on mental health.
- The information is based on data from the National Institute of Arthritis and Musculoskeletal and Skin Diseases (NIAMS).
Infographic 3: Understanding Knee Osteoarthritis From Early Signs to Advanced Disease

- This infographic focuses on osteoarthritis, a degenerative joint disease where joint tissues break down.
- It highlights that women are more susceptible, especially after menopause.
- The infographic outlines the stages of knee osteoarthritis, from early cartilage loss to significant cartilage damage.
- It emphasizes the increasing prevalence of osteoarthritis with age, with 73% of those affected being over 55 years old.
Infographic 4: Osteoarthritis Signs, Symptoms & Epidemiology

- This infographic provides information on osteoarthritis, a degenerative joint disease caused by the breakdown of cartilage.
- It highlights that 73% of people living with osteoarthritis are over 55 years old, with 60% being female.
- Common signs and symptoms include joint changes that limit movement, morning stiffness lasting less than 30 minutes, swelling, especially after activity, and pain when using the affected joint.
- The information is based on data from the National Institute of Arthritis and Musculoskeletal and Skin Diseases (NIAMS).
Infographic 5: Osteoarthritis Managing Your Condition Through Preventive Care

- This infographic focuses on preventive care and patient education for managing osteoarthritis.
- It emphasizes the importance of rest, exercise, and maintaining a healthy weight to reduce pain and improve joint health.
- The infographic also provides patient education on joint protection strategies, such as relying on larger joints or stronger muscles to perform tasks and modifying workspaces to avoid prolonged standing.
- Additionally, it highlights the importance of good posture and wearing comfortable, supportive shoes to minimize stress on the joints.
- These strategies can help individuals with osteoarthritis improve their quality of life and manage their condition effectively.
Infographic 6: Osteoarthritis Diagnosis & Management

- This infographic focuses on osteoarthritis, a condition where the cartilage cushioning joints breaks down.
- It states that 595 million people worldwide had osteoarthritis in 2020, with women being more susceptible, especially after menopause.
- The infographic highlights risk factors such as overweight, inactivity, family history, joint injuries, and aging.
- It also outlines diagnostic methods, including medical history, physical exams, blood tests, and joint fluid samples.
- Finally, it emphasizes preventive measures like getting rest, modifying activities, and using assistive devices.
Infographic 7: Osteoarthritis in Women The Role of Hormones & Lifestyle

- This infographic explores the factors contributing to women's higher risk of developing osteoarthritis.
- It highlights that hormonal changes, particularly after menopause, play a crucial role in inflammation.
- Additionally, weight gain is common during menopause, further increasing the risk.
- Women's wider hips can also contribute to joint stress.
- The infographic emphasizes that female athletes experience a higher rate of ACL injuries, increasing their risk of future osteoarthritis.
- To manage this risk, women are advised to maintain a healthy weight, include exercise in their daily routine, stay flexible to reduce injury risk, and consult a doctor for appropriate treatment options.
Infographic 8: Understanding Osteoarthritis Joints at Risk & Exploring PRP Treatment

- This infographic provides information on osteoarthritis, a degenerative joint disease, highlighting the joints most commonly affected, including the neck, lower back, hips, knees, and base of the toe.
- It also introduces platelet-rich plasma (PRP) therapy as a potential treatment option.
- PRP therapy involves drawing a small amount of blood from the patient, separating the platelets through centrifugation, and then injecting the concentrated platelets into the affected joint.
Infographic 9: Osteoarthritis Stages, Symptoms & Treatment Options

- This infographic provides an overview of osteoarthritis, outlining its stages and associated symptoms.
- It describes four stages of the disease, starting with mild cartilage wear and tear and progressing to severe cartilage loss.
- Common symptoms include joint pain, loss of flexibility, and a grating sensation within the joint.
- The infographic also presents pharmacological treatment options for osteoarthritis, such as duloxetine (an SSRI), intra-articular injections (corticosteroids or sodium hyaluronate), muscle relaxants, and monoclonal antibodies that inhibit nerve growth factor.
Infographic 10: Understanding Osteoarthritis Demographics, Pathophysiology & Management

- This infographic provides a comprehensive overview of osteoarthritis, focusing on its demographics, pathophysiology, and strategies for living with the condition.
- It highlights that the prevalence of osteoarthritis increases significantly after age 50, with 80–90% of people over 65 showing evidence of the disease.
- The infographic also emphasizes that knee osteoarthritis is more common in Black women. Regarding pathophysiology, it explains the role of cartilage degeneration, subchondral bone changes, and synovial inflammation in the development of osteoarthritis.
- Finally, it outlines strategies for living with OA, including getting annual flu shots, regular check-ups with healthcare providers, seeking support from others, and adhering to prescribed medications.
Infographic 11: Osteoarthritis Comprehensive Guide

- This infographic provides a comprehensive overview of osteoarthritis, the most common form of arthritis, which affects around 500 million people globally.
- It explains that osteoarthritis occurs when the protective cartilage cushioning the ends of bones wears down over time, leading to joint pain and stiffness.
- The infographic highlights several risk factors for osteoarthritis, including older age, joint injuries, bone deformities, and being female.
- It also discusses the progression of the disease, from cartilage degradation to joint space narrowing and ultimately joint destruction.
- Finally, the infographic emphasizes the importance of non-pharmacologic interventions, such as physical activity and the use of assistive devices, in managing osteoarthritis and improving quality of life for patients.
Infographic 12: Diagnosing Osteoarthritis From Symptoms to Diagnosis

- This infographic focuses on osteoarthritis, explaining its age distribution and gender differences.
- While typically affecting those in their late 40s to mid-50s, younger individuals, including athletes and those with joint trauma, can also be affected.
- Women have a higher prevalence of osteoarthritis and experience more severe cases, particularly after age 40.
- The infographic details key symptoms such as pain, stiffness, tenderness, and a grating sensation in the joints.
- It also outlines the diagnostic path, including joint aspiration to rule out other conditions, X-rays to detect joint or bone damage, and MRI for detailed imaging of the joint and surrounding tissues.
Inforgraphic 13: Living with Osteoarthritis Guide to Daily Living
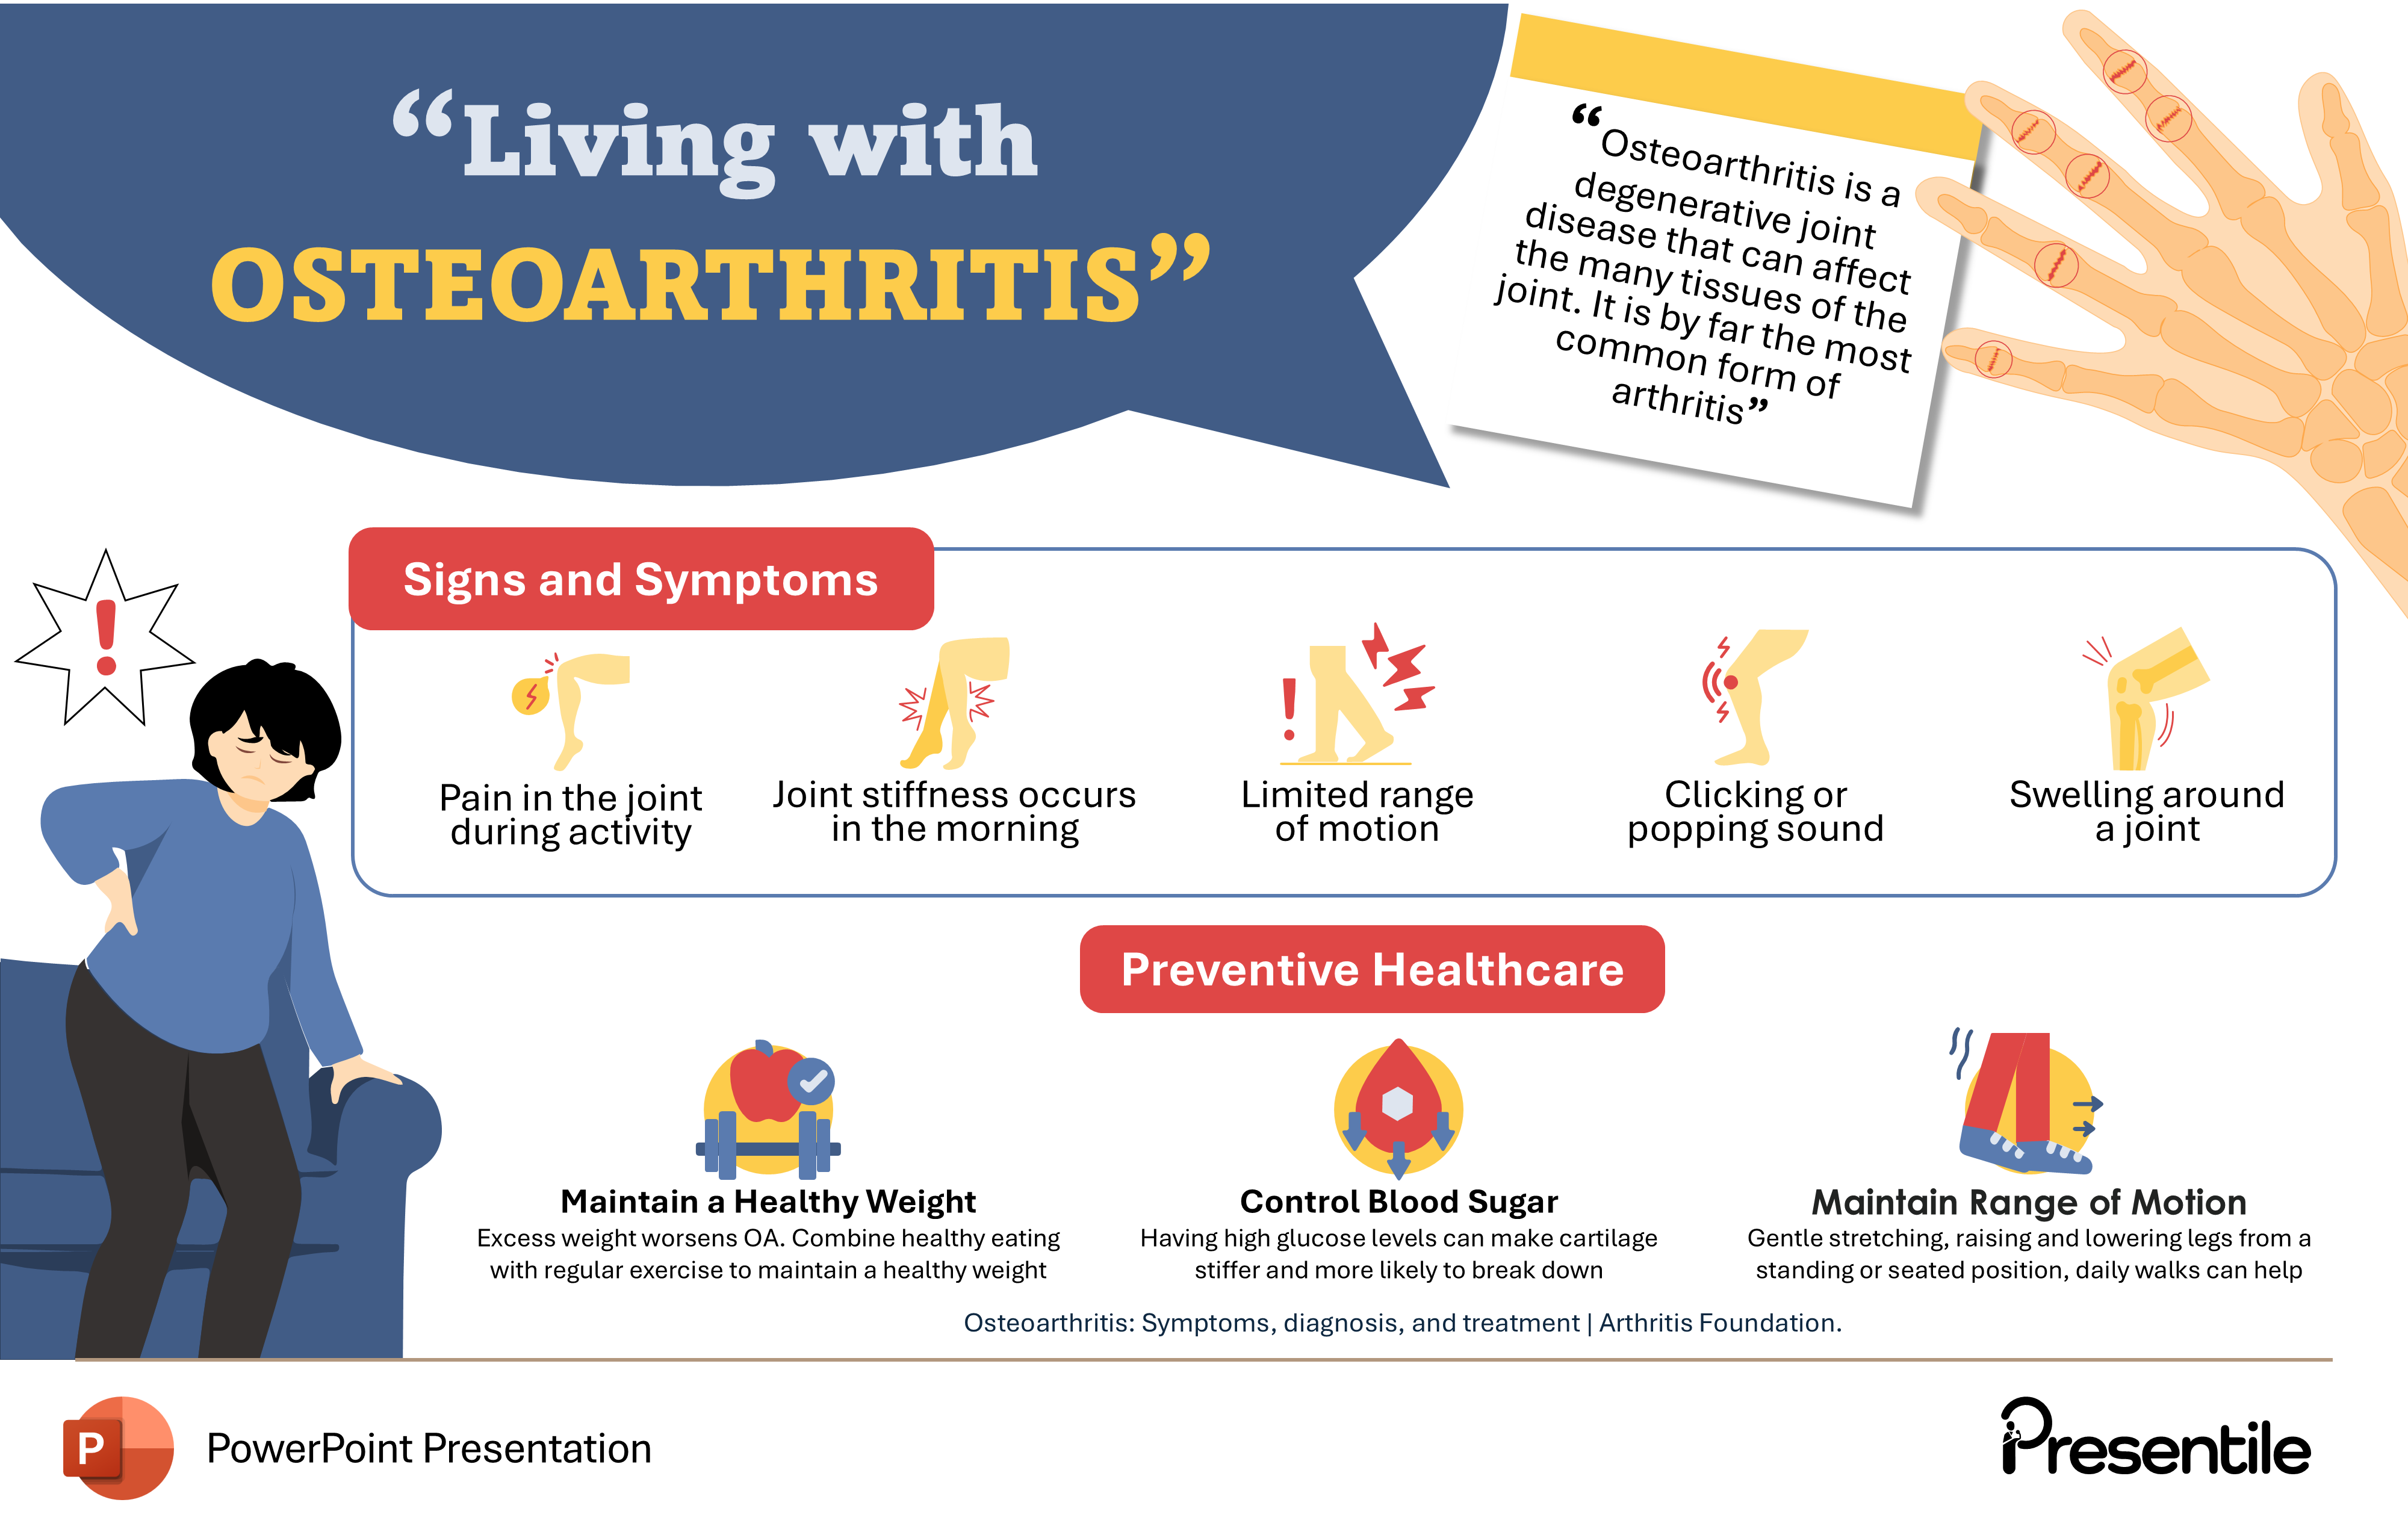
- This infographic focuses on "Living with Osteoarthritis," a degenerative joint disease affecting multiple tissues within the joint.
- Outlines key signs and symptoms, including joint pain during activity, morning stiffness, limited range of motion, clicking or popping sounds, and swelling around the joint.
- The infographic emphasizes the importance of preventative healthcare measures, such as maintaining a healthy weight through a combination of healthy eating and regular exercise.
- It also stresses the need to control blood sugar levels, as high glucose can contribute to cartilage breakdown.
- Finally, it recommends maintaining a range of motion-through activities like gentle stretching and daily walks to help manage osteoarthritis.
Infographic 14: Osteoarthritis in Women

- This infographic provides insights into osteoarthritis, a degenerative joint disease where joint tissues break down.
- It highlights that women are more prone to developing osteoarthritis, especially after menopause.
- The infographic outlines the stages of knee osteoarthritis, progressing from mild to severe cartilage damage.
- It emphasizes that osteoarthritis is the most common form of arthritis, affecting around 500 million people globally.
- Finally, it illustrates how osteoarthritis symptoms can vary depending on the affected joint, including pain and stiffness in the hips and knees, bony enlargements in the hands, and pain and stiffness in the neck and lower back.
Infographic 15: Osteoarthritis Risk Factors & Potential Complications

- This infographic focuses on osteoarthritis, exploring its risk factors and potential complications.
- It highlights that age, sex (with women being more susceptible), obesity, joint injuries, and genetics are key factors that increase the risk of developing osteoarthritis.
- The infographic also outlines potential complications such as joint misalignment, decreased range of motion, and difficulty ambulating.
- Additionally, it lists several conditions that may need to be considered when diagnosing Osteoarthritis, including radiculopathies, rheumatoid arthritis,psoriatic arthritis, crystalline arthritis, and hemochromatosis.
Infographic 16: Osteoarthritis Guide to Diagnosis & Management

- This infographic outlines the management of Osteoarthritis, starting with diagnosis.
- It explains that while X-rays can reveal cartilage loss by showing narrowing of the space between bones, MRI provides more detailed images of bone and cartilage.
- Blood tests help rule out other conditions like rheumatoid arthritis, and joint fluid analysis determines if the pain is due to infection or gout.
- Treatment approaches include pain relievers, supportive devices like shoe inserts and canes, exercise to improve joint mobility and muscle strength, and complementary therapies such asmassage, dietary supplements, meditation, and acupuncture.
Infographic 17: Osteoarthritis A Global Health Challenge Affecting Millions

- This infographic provides an overview of Osteoarthritis, a degenerative joint disease where the cartilage cushioning theends of bones breaks down, leading to bone-on-bone contact and the formation ofbone spurs.
- It highlights that Osteoarthritis is a prevalent condition,affecting 7% of the global population, with over 500 million people worldwide living with the disease.
- The infographic emphasizes that women are more susceptible to Osteoarthritis than men, especially after age 50.
- It further outlines the impact of Osteoarthritis on quality of life, noting that pain and difficulty in movement can hinder participation in daily activities, leading tomental health impacts and sleep disturbances.
Infographic 18: Advances in Osteoarthritis Treatment Medications and Therapies for Pain Relief

- This infographic highlights advances in Osteoarthritis therapy.
- It covers both medications and therapy options.
- Medications include acetaminophen, which can help some people with mild to moderate pain, NSAIDs like ibuprofen and naproxen sodium for pain relief, and duloxetine, an antidepressant also approved for chronic pain, including Osteoarthritis.
- Therapy options include physical therapy to strengthen muscles, increase flexibility, and reduce pain, occupational therapy to help people find ways to do everyday tasks without straining joints, and TENS (Transcutaneous Electrical Nerve Stimulation) for short-term pain relief.
Infographic 19: Understanding Osteoarthritis, Its Impact, and Management Strategies

- This infographic provides an overview of Osteoarthritis, highlighting that it affects approximately 30% of the population between the ages of 45 and 65.
- It explains that Osteoarthritis is a type of arthritis that primarily affects the joints, including the hands, knees, hips, and lower back.
- The infographic details the pathophysiology of the disease, explaining how the cartilage within the joints breaks down and wears away, leading to bone-on-bone contact and the formation of bone spurs.
- It emphasizes the importance of joint protection through proper exercise techniques and recommends a healthy lifestyle with balanced nutrition, no smoking, and moderate drinking to support joint health.
- The infographic mentions joint replacement surgery as an option for managing severe Osteoarthritis and improving pain and function in affected individuals.
Infographic 20: Osteoarthritis Explained Causes, Risk Factors, and Areas Affected

- This infographic provides an overview of Osteoarthritis, defining it as a degenerative "wear-and-tear" joint disease that typically leads to pain and stiffness.
- It explores several risk factors associated with developing Osteoarthritis, including genetics, past injuries, certain medical conditions, and age.
- The infographic also outlines different types of Osteoarthritis that can affect various areas of the body, such as hands, shoulders, spine, and cervical regions.
Infographic 21: Osteoarthritis Symptoms, Causes, and Effective Management Strategie

- This infographic provides an overview of Osteoarthritis, explaining that it occurs when the protective cartilage cushioning the ends of bones wears down over time.
- It highlights that this can damage any joint, but commonly affects the hands, knees, hips, and spine.
- The infographic lists symptoms such as loss of flexibility, tenderness, and stiffness, and outlines treatment strategies.
- These include weight reduction, acetaminophen for pain relief, rest to allow joint repair, 150 minutes of moderate physical activity weekly, and therapy to strengthen muscles around the joint and increase flexibility.
Infographic 22: Osteoarthritis on the Rise Global Prevalence, Risk Factors, and Key Symptoms

- This infographic provides an overview of Osteoarthritis, a chronic degenerative disease affecting the cartilage that cushions the joints.
- It highlights a significant increase in global prevalence, with 528 million people living with Osteoarthritis in 2019, representing a 113% increase since 1990.
- The infographic identifies common risk factors, including age, family history, muscle stress, and obesity.
- It also outlines key signs and symptoms, such as pain in the affected joints, the development of bone spurs, and swelling around the joint.
Infographic 23: An Overview on Osteoarthritis

- This infographic provides an overview of Osteoarthritis (OA).
- It defines OA as a chronic degeneration of the cartilage that cushions the joints. Regarding gender differences, it notes that osteoarthritis is more common in women than in men, illustrated by a female figure with an upward arrow indicating higher prevalence.
- The pathophysiology of OA is explained in three steps: deterioration of cartilage due to aging, causing the slick surface to become rough, and eventually leading to the cartilage wearing down completely, resulting in bone-on-bone rubbing.
- The infographic also highlights complications such as being unable to perform daily activities, experiencing joint stiffness and pain, and potentially needing replacement surgery.
- Finally, it presents a statistic stating that 59% of people who have osteoarthritis have knee osteoarthritis, visually represented with an emphasis on the knee. Overall, the infographic offers a concise summary of osteoarthritis, covering its definition, gender prevalence, disease progression, complications, and common affected areas.
Infographic 24: Understanding Osteoarthritis From Risk Factors to Joint Replacement Surgery

- This infographic describes Osteoarthritis as a degenerative joint disease that can affect multiple tissues within the joint.
- It highlights joint replacement surgery as a treatment option for restoring mobility and relieving pain in damaged joints, particularly in the hips and knees.
- The infographic lists several risk factors for developing Osteoarthritis, including joint injuries (fractures, strains, repetitive stress), pre-existing joint diseases such as rheumatoid arthritis and gout, obesity, and sociodemographic factors such as age and female sex.
Infographic 25: Living with Osteoarthritis Understanding Diagnosis and Managing Complications

- This infographic focuses on Osteoarthritis, defining it as a common degenerative disorder of the articular cartilage associated with hypertrophic bone changes.
- It highlights that a significant number of people living with Osteoarthritis experience moderate to severe levels of the condition and could benefit from rehabilitation.
- The infographic outlines diagnostic methods for Osteoarthritis, including X-ray, MRI, and joint aspiration.
- It also emphasizes potential complications associated with the condition, such as poor sleep, depression, anxiety, and osteonecrosis, which can cause severe joint pain and limited mobility.
Infographic 26: Osteoarthritis Risk Factors and Underlying Causes Explained

- This infographic focuses on Osteoarthritis, a type of arthritis that primarily affects the joints, particularly in the hands, knees, hips, neck, and lower back.
- It highlights several factors that increase the risk of developing Osteoarthritis, including aging, being overweight, and having a history of joint injury or surgery.
- The infographic also explores potential real causes of Osteoarthritis, such as joint trauma, diabetes, genetics, and repeated stress on the joint.
Infographic 27: Osteoarthritis A Systemic Joint Disease Impacting Mobility and Quality of Life

- This infographic describes Osteoarthritis as a complex disease affecting not just cartilage, but also bone, meniscus, synovial tissues, tendons, ligaments, and muscles around the joint, a condition likened to "joint failure."
- It emphasizes that Osteoarthritis can affect multiple joints in different ways, leading to pain, stiffness, and reduced mobility in the hips; swelling, discomfort, and difficulty walking in the knees; pain, swelling, and difficulty gripping in the hands; and pain and trouble standing or walking in the feet.
- The infographic also highlights that having Osteoarthritis in one part of the body may increase the risk of developing it in other areas, according to the Arthritis Foundation.
Infographic 28: Understanding Osteoarthritis Causes, Prevalence, and Advanced Diagnostic Methods

- This infographic highlights Osteoarthritis as a leading cause of pain and disability in the Western world.
- It describes the pathophysiology of the disease, including the breakdown of cartilage, remodeling of subchondral bone, and inflammation of the synovial lining.
- The infographic also presents data on the global prevalence of Osteoarthritis, indicating a significant number of cases, particularly among younger adults.
- It outlines diagnostic methods, including blood tests to assess inflammation, musculoskeletal MRI for evaluating injuries, and synovial fluid analysis to identify the cause of joint pain and swelling.
Infographic 29: Osteoarthritis A Painful Reality for Millions, Especially Older Women

- The infographic describes Osteoarthritis, a common condition causing pain and limited function, especially in older women.
- With 365 million cases, the knee is most affected, followed by the hip and hand. It outlines types like primary (developing over time) and secondary (due to injury).
- Complications include chronic pain and stiffness, potentially leading to difficulty in daily tasks and affecting sleep and mood.
Infographic 30: Osteoarthritis A Widespread Condition Impacting Millions of Older Adults

- This infographic describes Osteoarthritis, a condition affecting multiple joints, often developing gradually.
- It highlights that 80% of US adults over 65 have radiographic evidence of Osteoarthritis, with 60% experiencing symptoms.
- Risk factors include female sex, metabolic diseases, genetics, and bone deformities. The infographic emphasizes the role of occupational therapy in helping individuals manage daily tasks while minimizing stress on affected joints.
Infographic 31: Osteoarthritis The Most Common Arthritis and How Weight Impacts Joint Health

- This infographic focuses on Osteoarthritis, highlighting it as the most common form of arthritis.
- It emphasizes the impact of obesity, stating that even a small increase in weight can significantly increase the force on the knee.
- The infographic lists common symptoms of Osteoarthritis, including lack of flexibility, stiffness, and joint pain.
- It discusses diagnostic methods, such as blood tests to rule out other conditions and X-rays to confirm the diagnosis.
- The infographic also highlights the importance of maintaining a healthy weight and improving physical activity as part of the treatment approach.
Infographic 32: Living with Osteoarthritis Managing Joint Health and Staying Active

- This infographic highlights the significant impact of Osteoarthritis on quality of life, noting that people with the condition often experience limitations in their daily activities, impacting their well-being and mental health.
- It identifies the knee and hip as the most commonly affected joints.
- The infographic outlines risk factors, including genetics, bone deformities, and repetitive stress on joints.
- It also emphasizes the importance of physical activity, stating that individuals with Osteoarthritis who lack regular walking have an increased risk of mortality.
- X-ray findings, such as subchondral sclerosis and joint space narrowing, are also highlighted.
- The infographic notes that 1 in 6 adults over the age of 50 experience foot Osteoarthritis.
Infographic 33: How to Understand Osteoarthritis

- This infographic provides an overview of Osteoarthritis, the most common form of arthritis, which occurs when the protective cartilage cushioning the ends of bones wears down over time.
- It highlights that Osteoarthritis affects approximately 528 million people worldwide, with 60% of cases occurring in females, particularly affecting the knee and hand after menopause.
- The infographic emphasizes the impact of Osteoarthritis on quality of life, noting that it primarily affects the hands, knees, neck, and lower back.
- It discusses diagnostic methods, including medical history, X-rays, and blood tests, and highlights obesity as a significant risk factor, as increased weight puts additional stress on weight-bearing joints.
Infographic 34: The Most Common Form of Arthritis

- This infographic provides an overview of Osteoarthritis, highlighting it as the most common form of arthritis, affecting almost 20% of the world's population.
- It emphasizes the role of several risk factors, including obesity (BMI > 30 kg/m²), genetics, and dietary deficiencies in vitamins D, C, and K.
- The infographic states that 73% of people with Osteoarthritis are older than 55 years and that 60% of cases occur in females.
- It also notes that the knee is the most commonly affected joint, followed by the hip and hand.
- Common symptoms include joint pain, which tends to worsen with cold temperatures.
Infographic 35: Osteoarthritis Epidemiology in Women

- The infographic focuses on the Epidemiology of Osteoarthritis in Women.
- It highlights that women are more likely than men to develop osteoarthritis and experience more joint pain.
- This difference is particularly pronounced after menopause due to changes in estrogen levels and its protective effects on bones.
- The infographic states that 60% of people living with osteoarthritis are women.
- It also emphasizes that women are more likely to have osteoarthritis in the hands, with the base of the thumb joint being commonly affected.
Infographic 36: Who Gets Osteoarthritis? Age and Gender Factors

- This infographic provides an overview of Osteoarthritis, highlighting it as the most common joint disease involving changes to the entire joint.
- It emphasizes the influence of age, with 30% of the population between ages 45-65 and 80% of the population over 65 experiencing Osteoarthritis.
- The infographic notes that women are more likely to develop Osteoarthritis than men, particularly after menopause.
- It outlines diagnostic methods, including X-rays, MRI, and joint fluid analysis, and discusses treatment options such as weight reduction, painkillers, physical therapy, and assistive devices
Infographic 37: The Growing Burden of Osteoarthritis

- This infographic provides an overview of Osteoarthritis, a joint disease resulting from the breakdown of cartilage and bone.
- It highlights Osteoarthritis as a leading cause of disability worldwide, with a projected increase in prevalence by 2030.
- The infographic emphasizes the significant functional impairment associated with hand Osteoarthritis, comparable to that of Rheumatoid Arthritis.
- It discusses arthroscopy as a surgical treatment option for addressing issues like damaged cartilage and bone fragments.
- The infographic illustrates the progression of Osteoarthritis, starting with cartilage degeneration, followed by synovial inflammation and subchondral bone changes.
Infographic 38: Diagnosing and Treating Osteoarthritis

- This infographic provides key facts about Osteoarthritis.
- It highlights that 13% of adults aged 25+ and 33.6% of people aged 65+ are affected by the condition.
- The infographic emphasizes that Osteoarthritis of the knee is more prevalent in African Americans than in Whites.
- Radiographic imaging, including X-rays and MRI, plays a crucial role in diagnosis, with joint erosions, bone marrow lesions, and synovitis being key findings.
- The infographic also outlines various treatment approaches, including physical activity, surgery, and the use of supporting devices.
Infographic 39: Osteoarthritis A Leading Cause of Disability

- This infographic emphasizes Osteoarthritis as the leading cause of disability worldwide.
- It highlights several risk factors, including female gender, particularly for women aged 50 and above, joint injuries, and family history.
- The infographic outlines diagnostic methods, such as blood tests and joint fluid analysis, to rule out other conditions like rheumatoid arthritis and gout.
- It also warns of potential complications associated with Osteoarthritis, including weight gain, sleep disruption, reduced productivity, and anxiety and depression.
Infographic 40: Osteoarthritis Impact on Women and Older Adults

- This infographic provides an overview of Osteoarthritis, identifying it as a type of Degenerative Joint Disease.
- It highlights that women are disproportionately affected, with about 60% of people living with Osteoarthritis being female.
- The infographic emphasizes the increasing prevalence of Osteoarthritis, particularly knee OA, which is expected to rise with increasing life expectancy and obesity rates.
- It notes that Osteoarthritis is more common in older individuals, with 70% of those affected being over 55 years old.
- The infographic outlines the diagnostic process, which involves a review of symptoms and laboratory tests.
Infographic 41: How to Manage Osteoarthritis

- This infographic addresses the management of Osteoarthritis, highlighting its increasing global prevalence and status as a major cause of disability in older adults.
- It emphasizes that current treatments cannot reverse the condition and often present challenges or adverse effects, underscoring the importance of personalized management.
- Key management options presented include exercise and participation in self-management programs, weight loss for knee and hip osteoarthritis, and the use of oral and topical nonsteroidal anti-inflammatory drugs (NSAIDs) as pharmacological interventions, with topical NSAIDs specifically noted for knee osteoarthritis.
- The infographic also points out the significant economic burden of osteoarthritis in high-income countries.
Infographic 42: Osteoarthritis Epidemiology in Australia

- This infographic on the Epidemiology of Osteoarthritis highlights the growing global impact of the condition.
- It attributes the increasing prevalence to longer lifespans and projects that osteoarthritis will become the leading cause of disability worldwide by 2030.
- Focusing on Australia, it notes that a significant number of knee replacements, specifically 53.5 thousand, were performed in 2021-2022 to treat the condition.
- Furthermore, it presents global prevalence data for knee osteoarthritis, reporting 16% in individuals over 15 years and a higher rate of 22.9% in those aged 40 and older.
- Through these statistics and accompanying visuals, the infographic underscores the widespread and increasing burden of osteoarthritis on a global scale.
Infographic 43: How to Live With Osteoarthritis

- This infographic provides guidance on "How to live with Osteoarthritis," noting it as the most common form of arthritis.
- It describes osteoarthritis as a chronic and progressive condition primarily affecting the knees, hips, spine, and hands, illustrated by a person experiencing knee pain.
- The infographic presents several management strategies: using heat and cold therapies to reduce joint pain, utilizing support devices like canes or walkers to aid mobility, avoiding repetitive motions such as frequent bending, and engaging with support groups, both online and in the community.
- Additionally, it highlights the importance of keeping athletes active, stating that neuromuscular training exercise can reduce the risk of osteoarthritis by 80%, accompanied by an image of a person lifting weights.
- Overall, the infographic offers a range of self-management and preventative approaches for individuals dealing with or at risk of osteoarthritis.
Infographic 44: Osteoarthritis Risk Factors & Risk Group

- This presentation slide provides an overview of Osteoarthritis (OA), defining it as a degenerative joint disease involving the breakdown of cartilage and underlying bone.
- It outlines several risk factors that can increase the likelihood of developing OA, including overuse from repetitive joint movements, a history of injury or surgery to a joint, being overweight or obese, and having joints that did not form correctly.
- The slide also identifies key risk groups, noting that women are more prone to developing osteoarthritis, particularly after the age of 50.
- Additionally, it points out that younger individuals can also be affected, often as a consequence of accidental joint injuries, genetic defects in joint cartilage, or abnormal joint structures.
- The slide effectively uses concise text and illustrative icons to convey the essential information about the definition, risk factors, and at-risk populations for Osteoarthritis.
Infographic 45: How to Know That You Have Osteoarthritis

- This infographic, titled "How to know that you have OSTEOARTHRITIS?", details the characteristic signs and symptoms of the condition, alongside information about its prevalence in specific populations.
- Common symptoms highlighted include pain experienced during joint use, joint stiffness typically lasting less than 30 minutes, changes in the joint that can restrict movement, and swelling in the affected area.
- The infographic further illustrates how osteoarthritis can affect different joints in the body, such as bony enlargements and shape changes in the hands, pain and a potential grinding sensation in the knees during movement, pain and stiffness in the hips potentially radiating to the groin or thigh, and stiffness and pain in the neck or lower back.
- Notably, the infographic also presents data suggesting that First Nations people may be 1.5 times more likely to have osteoarthritis compared to non-Indigenous populations, based on the visual representation provided.
Infographic 46: Osteoarthritis Diagnosis

- This infographic details the multifaceted approach to Osteoarthritis (OA) diagnosis, defining OA as a degenerative joint disease involving cartilage and bone breakdown.
- The diagnostic process encompasses radiographic imaging, including X-rays which can reveal joint space loss and bone changes, although early damage may not be apparent, and Magnetic Resonance Imaging (MRI), which is valuable for assessing soft tissue damage and evaluating problematic joints.
- Laboratory tests, such as blood work and joint fluid analysis, play a crucial role in ruling out other conditions that might mimic OA symptoms, like infection or gout.
- Finally, clinical assessment is essential, involving a comprehensive medical history that includes the patient's symptoms, family medical history, and current medications, alongside a physical examination to assess overall health, reflexes, and the affected joints. This multi-pronged approach ensures a thorough and accurate diagnosis of Osteoarthritis.
Infographic 47: Osteoarthritis Pathophysiology

- This presentation slide offers a concise overview of Osteoarthritis (OA), addressing its age-related prevalence, the progressive nature of its pathophysiology, and significant contributing risk factors.
- The infographic emphasizes that the likelihood of developing osteoarthritis increases notably after the age of 45. In terms of its progression, the infographic illustrates three stages of OA: mild, where pain is occasional and activity-related; moderate, characterized by more frequent and prolonged pain with milder exertion; and severe, where pain can be present even at rest, indicating significant joint damage.
- Key risk factors highlighted include advancing age itself, a higher prevalence in women compared to men, obesity as a major contributor, and a history of severe joint injuries. Through these points and accompanying visuals, the slide provides a foundational understanding of the epidemiology and development of osteoarthritis.
Features of
Osteoarthritis PowerPoint Infographics
- Fully editable in PowerPoint
- All graphics are in vector format
- Medically Referenced information and data
Osteoarthritis PowerPoint Infographics
Osteoarthritis PowerPoint Infographics
Price:
$ 29.00 USD
Specifications
 Slides count:
 Compatible with:Microsoft PowerPoint
 File type:PPTX
 Dimensions:16:9
Files Included
- Non-animated PowerPoint
- Animated PowerPoint File
- Animated PowerPoint with Voice Over
- PDF Documents with presentation script
Elevate Your Work with Our Innovative Slides
Thank you! Your submission has been received!
Oops! Something went wrong while submitting the form.


