


No items found.
Content of
Rheumatoid Arthritis PowerPoint Infographics
Infographic 1: Rheumatoid Arthritis An Overview

- This infographic provides an overview of rheumatoid arthritis, a chronic autoimmune disease affecting 0.5% to 1% of the global population.
- It highlights key symptoms, including joint stiffness, especially in the morning, and swollen, tender joints.
- Pain worsens with movement, and a low-grade fever may also be present.
- The infographic emphasizes the importance of a multi-faceted diagnostic approach, including assessments of physical ability, blood tests to detect inflammation, and joint scans such as X-rays, MRIs, or ultrasounds.
Infographic 2: Treatment and Management of Rheumatoid Arthritis

- This infographic provides an overview of rheumatoid arthritis, describing it as a chronic systemic inflammatory disease of unknown origin that primarily affects the hands and feet, potentially leading to joint damage.
- Women are affected by rheumatoid arthritis approximately three times more frequently than men.
- The infographic outlines management strategies, including pharmacologic therapy with medications like Methotrexate and Tofacitinib.
- Non-pharmacologic approaches such as exercise to improve mobility, equipment to ease joint strain, and dietary modifications to reduce inflammation.
Infographic 3: Recognizing and Diagnosing Rheumatoid Arthritis
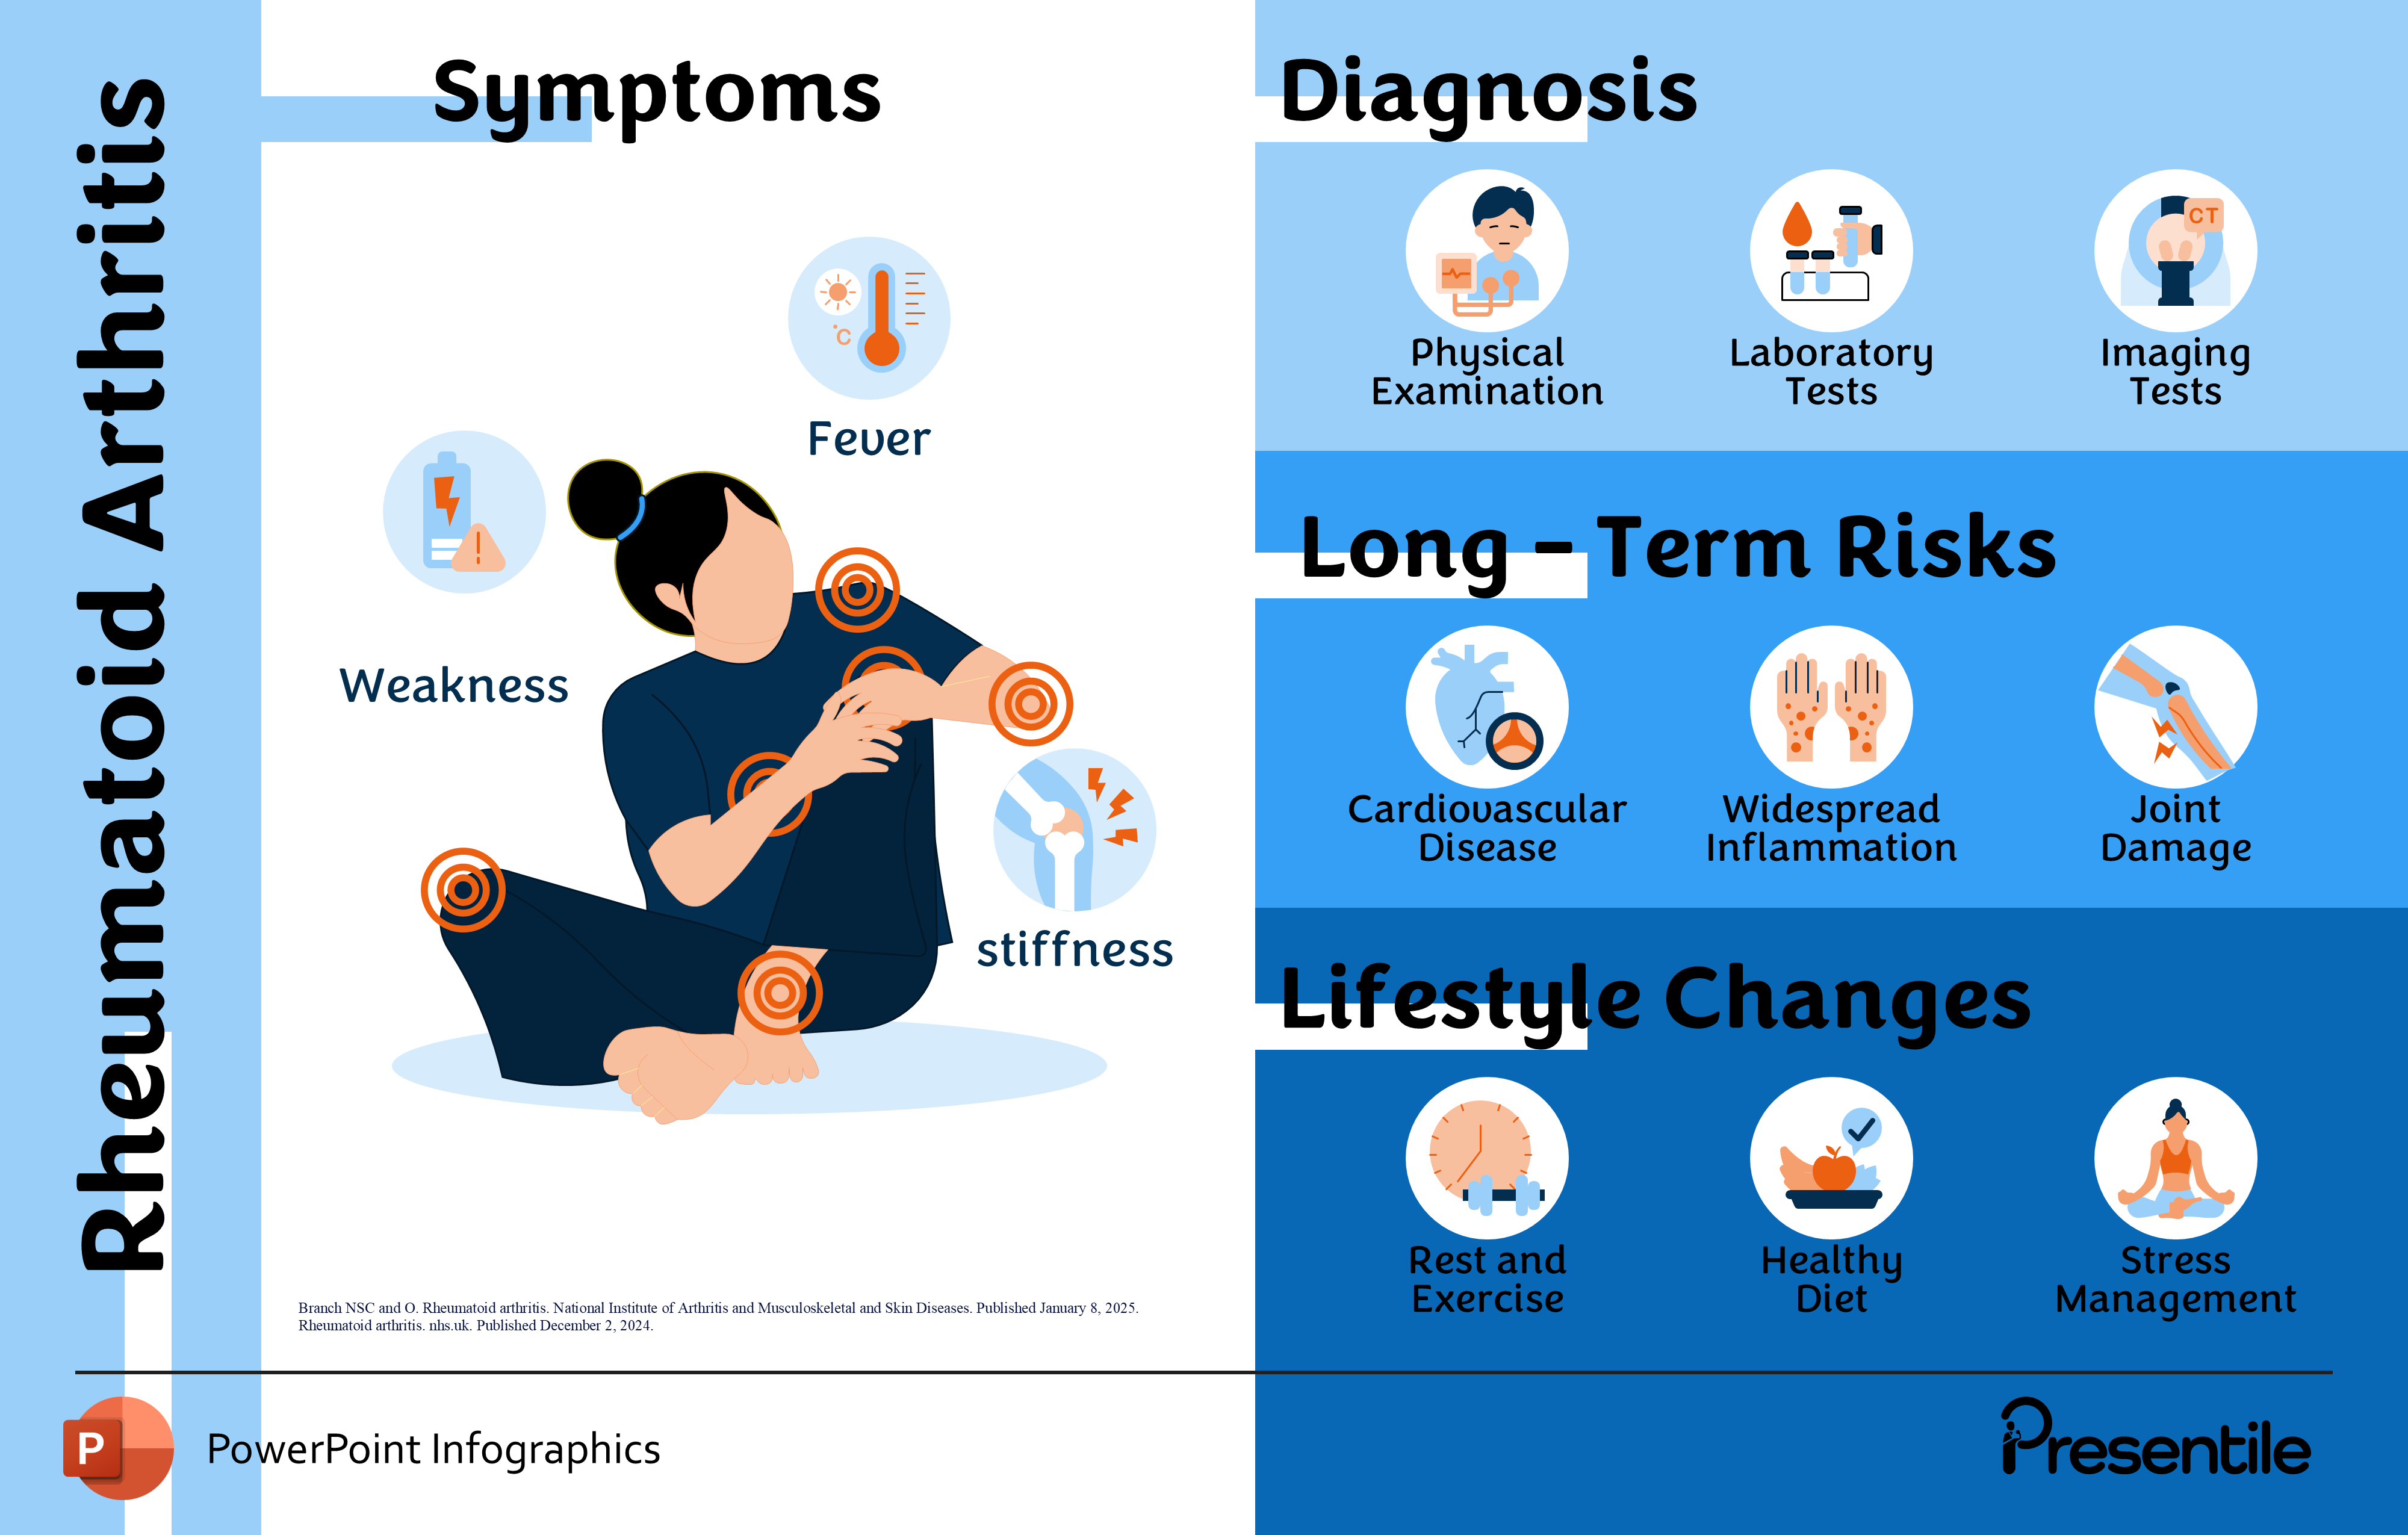
- This infographic provides an overview of Rheumatoid Arthritis, highlighting key symptoms such as fever, weakness, and stiffness.
- It emphasizes the importance of a comprehensive diagnostic approach, including physical examination, laboratory tests, and imaging studies.
- The infographic warns of potential long-term complications of Rheumatoid Arthritis, such as cardiovascular disease, widespread inflammation, and joint damage.
- It concludes by emphasizing the significance of lifestyle changes in managing the condition, including rest and exercise, a healthy diet, and stress management techniques.
Infographic 4: Challenges in Early Diagnosis of Rheumatoid Arthritis

- This infographic emphasizes the crucial role of early detection in managing Rheumatoid Arthritis, noting that 18 million people were affected by the disease in 2019.
- The infographic highlights the challenges associated with early diagnosis, such as the similarity of symptoms to other types of arthritis, variability of symptoms between individuals, and the presence of few symptoms in the early stages.
- It also emphasizes that there is no single test for the disease.
- Imaging studies, including X-rays, CT scans, and MRI, play a vital role in diagnosis, with X-rays used to monitor disease progression and MRI being particularly useful in the early stages.
Infographic 5: Rheumatoid Arthritis Systemic Implications

- This infographic provides an overview of Rheumatoid Arthritis, highlighting potential health effects such as eye inflammation, mouth irritation, decreased red blood cell count, and heart damage.
- It outlines the diagnostic process, which typically involves medical history, blood tests, and imaging studies.
- The infographic emphasizes the importance of prevention strategies, including maintaining a healthy diet, stress reduction techniques like meditation and massage, daily movement such as taking the stairs, and building a positive support network.
Infographic 6: Rheumatoid Arthritis Risk Factors, Prevention, and Research

- This infographic provides an overview of Rheumatoid Arthritis, describing it as a chronic disease that causes inflammation, primarily presenting with joint pain.
- It highlights key risk factors, including smoking, female gender, and obesity.
- The infographic emphasizes preventive strategies such as smoking cessation, maintaining a healthy diet, and engaging in regular physical activity.
- It also outlines promising areas of future research, including the identification of biomarkers to predict disease progression, the development of personalized treatment plans, and the use of targeted biologics to regulate the immune system.
Infographic 7: Hip RA an Important Consideration in Rheumatoid Arthritis

- This infographic emphasizes the importance of early detection in Rheumatoid Arthritis, highlighting that 15 to 28% of people with the condition develop hip RA.
- It outlines key symptoms, including joint pain, morning stiffness, swelling, and fatigue.
- The infographic identifies genetic factors, such as FDR status, and environmental factors, particularly cigarette smoking, as risk factors for disease progression.
Infographic 8: Rheumatoid Arthritis The Immune System and Beyond

- This infographic provides an overview of Rheumatoid Arthritis, highlighting that 18 million people were affected by the disease in 2019.
- It emphasizes the higher prevalence of Rheumatoid Arthritis in women, who are 2 to 3 times more likely to develop the condition than men.
- The infographic suggests that strong immune responses can increase an individual's susceptibility to autoimmune diseases like Rheumatoid Arthritis.
- It also warns of potential complications associated with the disease, including gastrointestinal problems, osteoporosis, lung disease, heart disease, and an increased risk of infections due to the use of immunosuppressive drugs.
Infographic 9: Rheumatoid Arthritis Risks, Complications & Who's Most Affected

- This infographic provides an overview of Rheumatoid Arthritis, an autoimmune disorder.
- It highlights that women are 2 to 3 times more likely to develop RA compared to men.
- The infographic also emphasizes the potential complications associated with RA, including GI problems (stomach and intestinal distress), osteoporosis (particularly in postmenopausal women), lung disease (pulmonary inflammation), heart disease (coronary ischemic heart disease), and increased risk of infections due to the use of immunosuppressive drugs.
Infographic 10: The 4 Stages of Rheumatoid Arthritis Progression & Complications

- This infographic illustrates the progression of Rheumatoid Arthritis, a chronic autoimmune disorder.
- It outlines four stages:
- Stage 1, characterized by inflammation in the tissue around the joint;
- Stage 2, where inflammation begins to damage cartilage;
- Stage 3, with severe inflammation causing bone damage;
- Stage 4, where inflammation subsides but joint damage persists.
- The infographic also highlights potential complications associated with Rheumatoid Arthritis, including gastrointestinal problems, joint deformities, lung disease, and an increased risk of infection due to the use of immunosuppressive medications.
Infographic 11: Rheumatoid Arthritis Worldwide Prevalence, Risk Factors & Impact

- This infographic provides an overview of the global epidemiology of Rheumatoid Arthritis.
- It highlights that 0.5% to 1% of the global population is affected by the disease, with higher rates observed in Northern Europe and North America.
- The infographic emphasizes that women are 2 to 3 times more likely to develop Rheumatoid Arthritis compared to men.
- It notes that the disease typically presents between the ages of 30-60, although onset can occur at any age.
- The infographic points out that Rheumatoid Arthritis is associated with increased mortality and a shorter life expectancy for affected individuals.
- In the United States alone, 1.3 million adults are living with the condition.
Infographic 12: Global Prevalence and Impact of Rheumatoid Arthritis

- This infographic provides an overview of the global epidemiology of Rheumatoid Arthritis.
- It highlights that 0.5% to 1% of the global population is affected by the disease, with higher rates observed in Northern Europe and North America.
- The infographic emphasizes that women are 2 to 3 times more likely to develop Rheumatoid Arthritis compared to men.
- It notes that the disease typically presents between the ages of 30-60, although onset can occur at any age.
- The infographic points out that Rheumatoid Arthritis is associated with increased mortality and a shorter life expectancy for affected individuals.
- In the United States alone, 1.3 million adults are living with the condition.
Infographic 13: Understanding Rheumatoid Arthritis Risk Factors and Symptoms

- This infographic provides a guide to Rheumatoid Arthritis, outlining key risk factors such as female sex, increasing age (particularly onset in middle age), smoking, and excess weight.
- It highlights the symptoms of Rheumatoid Arthritis, including tender, warm, and swollen joints, morning stiffness, and fatigue.
- The infographic emphasizes the higher prevalence of rheumatoid arthritis in women, stating that they are three times more likely to develop the condition compared to men.
Infographic 14: Rheumatoid Arthritis Overview, Stages, and Diagnosis

- This infographic provides an overview of Rheumatoid Arthritis, describing it as a chronic autoimmune disease that causes pain, swelling, and stiffness in the joints.
- It highlights that 70% of people living with rheumatoid arthritis are women and 55% are older than 55 years.
- The infographic outlines the stages of RA, progressing from synovitis (inflammation) to pannus formation (cartilage loss), fibrous ankylosis (joint invasion by fibrous tissue), and finally bony ankylosis (bone fusion).
- It also emphasizes the importance of diagnosis, which involves a combination of medical history, physical examination, blood tests, and imaging studies.
Infographic 15: Rheumatoid Arthritis Effects on Joints and Beyond

- This infographic provides an overview of Rheumatoid Arthritis, describing it as a chronic disease that causes inflammation throughout the body, commonly presenting with joint pain.
- It highlights that women are more likely to develop RA than men, typically in middle age.
- The infographic emphasizes the potential for severe joint damage if left untreated and outlines potential health effects beyond the joints, including eye inflammation, heart damage, decreased red blood cell count, and lung inflammation.
Infographic 16: Rheumatoid Arthritis Symptoms, Causes, and Diagnosis

- This infographic provides an overview of Rheumatoid Arthritis, explaining that it's an autoimmune disease where the immune system mistakenly attacks the lining of the joints, causing inflammation and pain.
- Typically affects the same joints on both sides of the body.
- The infographic highlights key symptoms, including joint pain, tenderness, swelling, and morning stiffness lasting for at least 30 minutes.
- This infographic also discusses the role of imaging scans in diagnosis, such as X-rays to assess joint damage, MRI for detailed images, and ultrasound to detect joint inflammation.
Infographic 17: Key Facts and Complications of Rheumatoid Arthritis

- This infographic provides key facts about Rheumatoid Arthritis, an autoimmune disorder where the immune system mistakenly attacks the body's own tissues.
- It highlights that globally, about 18 million people live with RA, a number expected to increase.
- The infographic emphasizes potential complications associated with RA, including osteoporosis, rheumatoid nodules, dry eyes and mouth, and an increased risk of lymphoma.
Infographic 18: Managing Rheumatoid Arthritis Pain and Treatment Options

- This infographic outlines strategies for managing Rheumatoid Arthritis, emphasizing the importance of pain management techniques.
- It suggests using heat and cold therapy, incorporating physical therapy to restore joint function, and maintaining a healthy weight to minimize the impact of obesity on the condition.
- The infographic also highlights the role of treatment options, including disease-modifying anti-rheumatic drugs (DMARDs) to ease symptoms and slow disease progression, as well as biological treatments that target the immune system to reduce inflammation.
Infographic 19: The Importance of Early Treatment for Rheumatoid Arthritis

- This infographic provides an overview of Rheumatoid Arthritis, stating that it affects approximately 1% of the global population.
- It highlights that untreated RA can have severe long-term consequences, including joint disfigurement, osteoporosis, and spinal complications.
- The infographic emphasizes the importance of early treatment and outlines the first-line therapies for RA, such as disease-modifying antirheumatic drugs (DMARDs) like methotrexate, JAK inhibitors that suppress the immune response, and corticosteroids for short-term pain relief.
Infographic 20: The Variable Journey of Rheumatoid Arthritis and Its Risks

- This infographic outlines the journey through Rheumatoid Arthritis (RA), highlighting that it affects individuals differently.
- It emphasizes that women are at a significantly higher risk of developing RA compared to men, and that risk factors include smoking and obesity.
- The infographic also discusses the potential complications associated with RA, including an increased risk of viral infections, dry eyes and mouth, heart disease, and carpal tunnel syndrome.
- This Infographic also emphasizes the variable nature of RA, with some individuals experiencing a gradual onset of symptoms while others experience rapid disease progression.
Infographic 21: Rheumatoid Arthritis Beyond Joints and Its Mental Health Impact

- This infographic explores Rheumatoid Arthritis, emphasizing its systemic nature beyond joint inflammation.
- It discusses associated joint conditions like carpal tunnel syndrome, rheumatoid nodules, and tenosynovitis.
- The infographic outlines surgical treatment options, including joint replacement, arthrodesis, and synovectomy.
- It also highlights the significant mental health impact of RA, including depression, anxiety, feelings of helplessness, and low self-esteem.
Infographic 22: Rheumatoid Arthritis A Systemic Disease Affecting Life Beyond Joints

- This infographic provides key facts about Rheumatoid Arthritis (RA), a chronic disease causing inflammation throughout the body, often manifesting as joint pain.
- It highlights the significantly higher prevalence of RA in women compared to men.
- RA is a systemic disease, meaning it can affect various organs and body systems beyond the joints, including the eyes, heart, lungs, and central nervous system.
- The infographic emphasizes the impact of RA on daily life, stating that it can limit physical activities and social connections due to pain and fatigue.
Infographic 23: Rheumatoid Arthritis Key Facts, Affected Joints, and Diagnostic Methods

- This infographic provides key facts about Rheumatoid Arthritis, a chronic autoimmune disease causing pain, swelling, and stiffness in the lining of the joints.
- It highlights that the condition most commonly affects the joints in the fingers, hands, wrists, knees, ankles, feet, and toes.
- The infographic emphasizes that women are disproportionately affected, with about 70% of people living with RA being women, and 55% being older than 55 years.
- Diagnostic methods outlined include X-rays, joint aspiration, nodule biopsies, blood tests to detect rheumatoid factors, and ultrasound imaging to assess for bone damage and inflammation.
Infographic 24: Rheumatoid Arthritis Risk Factors, Complications, and Treatment Options

- This infographic provides an overview of Rheumatoid Arthritis, describing it as a chronic disease that causes inflammation throughout the body and commonly presents with joint pain.
- It highlights several risk factors, including a family history of RA, female sex, smoking, and obesity.
- The infographic also discusses potential complications of RA, such as cardiovascular disease, cervical myelopathy, and joint damage.
- It mentions surgical treatment options for RA, including knee and hip replacement surgeries, emphasizing that while recovery time can be significant, these surgeries often improve quality of life for individuals with RA.
Infographic 25: Rheumatoid Arthritis Key Facts, Risk Factors, and Lifestyle Tips

- This infographic describes Rheumatoid Arthritis as an autoimmune disease that can cause joint pain, inflammation, and damage throughout the body.
- It states that in 2019, 18 million people worldwide were living with this condition.
- While the specific causes remain unknown, modifiable risk factors include smoking and obesity, while non-modifiable factors include genetics, female gender, and age.
- The infographic also provides lifestyle tips for managing RA, such as balancing activity and rest, using assistive devices like canes and walkers, and employing adaptive equipment to reduce strain.
Infographic 26: Rheumatoid Arthritis in Australia Prevalence, Complications, and Management

- This infographic provides information about Rheumatoid Arthritis (RA), stating that an estimated 428,000 Australians reported having the condition, representing approximately 2% of the population.
- RA typically develops between the ages of 30 and 60, but can occur at any age.
- The infographic lists potential complications of RA, including osteoporosis, heart disease, and interstitial lung disease.
- It also outlines management strategies, such as the use of medications for pain relief and inflammation, splints to protect joints, and joint fusion surgery as a last resort for severe cases.
Infographic 27: Rheumatoid Arthritis Symptoms, Causes, and Impact

- This infographic describes Rheumatoid Arthritis (RA) as a chronic condition that causes joint inflammation, leading to pain and stiffness.
- It is considered the second most common form of arthritis. RA is an autoimmune disorder, where the body's immune system mistakenly attacks its own tissues.
- While the exact cause is unknown, heredity is suspected to play a role.
- The infographic highlights that RA is more prevalent in women and typically begins between the ages of 35 and 50, though onset can occur at any age.
- It also points out some unexpected ways RA can affect the body, such as causing dry eyes, fatigue, chest pain, and skin rashes.
Infographic 28: Rheumatoid Arthritis Global Prevalence and Complications

- This infographic describes Rheumatoid Arthritis as an autoimmune condition where the body's immune system mistakenly attacks the tissues lining the joints, resulting in inflammation, swelling, and pain.
- The global prevalence of RA is estimated to range from 0.24 to 1%, with variations across different regions.
- The infographic highlights several potential complications of RA, including an increased susceptibility to viral infections, the development of carpal tunnel syndrome, and the risk of osteoporosis, a condition that weakens the bones.
Infographic 29: Rheumatoid Arthritis Risk Factors and Onset

- This infographic describes Rheumatoid Arthritis (RA) as a chronic autoimmune disease that primarily affects joints.
- In RA, the immune system mistakenly attacks the body's own tissues, leading to inflammation, pain, swelling, and loss of joint function.
- The infographic highlights that RA commonly develops between the ages of 40 and 50. It lists eating red meat, genetics, and a higher prevalence in women as potential risk factors for developing RA.
Infographic 30: Rheumatoid Arthritis Symptoms, Impact, and Treatment Options

- This infographic describes Rheumatoid Arthritis (RA) as a chronic disease that causes inflammation of the joints and affects approximately 1.5 million Americans.
- It highlights that RA impacts more than just joints, as immune cells can also attack tendons, blood vessels, and even organs like the heart and lungs.
- The infographic lists common symptoms of RA, including fatigue, joint pain, and stiffness, especially in the morning.
- Outlines potential treatment options, such as surgical cleaning of inflamed tissues, physical therapy to increase movement, and the use of medications for pain relief and inflammation management.
Infographic 31: Rheumatoid Arthritis Causes, Risk Factors, and Mortality Risk

- This infographic describes Rheumatoid Arthritis (RA) as a long-term condition that causes pain, swelling, and stiffness in the joints.
- It highlights that RA is likely caused by a combination of genetic, environmental, and hormonal factors.
- Genetic predisposition plays a role, and environmental factors such as smoking can trigger RA in individuals with susceptible genes.
- Sex hormones also influence the development of RA.
- The infographic emphasizes the increased mortality risk associated with RA, with individuals with RA having a 1.5 times higher mortality rate compared to the general population, primarily due to cardiovascular diseases, respiratory diseases, and infections.
Infographic 32: Rheumatoid Arthritis Diagnosis and Self-Management Tips

- This infographic describes rheumatoid arthritis (RA) as an autoimmune and systemic condition where the body's immune system attacks its own tissues, causing widespread symptoms like fatigue and flu-like illness.
- Diagnosis involves reviewing medical history, including symptoms and family history, a physical exam of the joints, and lab tests to detect immune-related markers.
- Imaging tests like X-rays or MRI help evaluate joint damage.
- The infographic also highlights self-management techniques such as staying active with 150 minutes of moderate weekly exercise, managing body weight, and preventing injuries that can worsen RA symptoms.
Infographic 33: Rheumatoid Arthritis Global Impact and Management Strategies

- This infographic describes Rheumatoid Arthritis (RA) as a chronic inflammatory disorder affecting not only joints but potentially damaging other body systems like the skin, eyes, lungs, heart, and blood vessels.
- Globally, around 17-18 million people are estimated to have RA, with women being two to three times more likely to be affected than men.
- The infographic highlights that RA typically develops between the ages of 30 and 50.
- Management strategies include lifestyle modifications such as regular exercise, a balanced diet, and relaxation techniques, along with medications like nonsteroidal anti-inflammatory drugs (NSAIDs) to manage pain and inflammation.
Infographic 34: Rheumatoid Arthritis Prevalence and Clinical Signs

- This infographic describes RA as a systemic autoimmune disease that affects multiple body systems, particularly the joints of the hands, wrists, feet, ankles, knees, shoulders, and elbows.
- It highlights that RA is more prevalent in women, with a 3:1 female-to-male ratio.
- The global prevalence of RA ranges from 0.5% to 1% in developed countries.
- Clinical signs of RA include joint pain, tenderness, swelling, and morning stiffness lasting for 30 minutes or longer.
- Systemic signs can include lung inflammation and heart damage.
- The infographic suggests that X-linked genetic factors, hormonal factors, and differing environmental exposures between men and women may contribute to the higher prevalence of RA in females.
Infographic 35: Diagnostic Process for Rheumatoid Arthritis

- This infographic outlines the diagnostic process for Rheumatoid Arthritis (RA).
- Blood tests play a crucial role, with elevated levels of Erythrocyte Sedimentation Rate (ESR) or C-reactive protein often indicating the presence of inflammation.
- Physical examination by a doctor involves looking for signs like bumps under the skin (rheumatoid nodules), limited joint movement, and swelling.
- Imaging tests, such as X-rays, MRI, and ultrasound, are also utilized to track the progression of RA in the joints and assess the severity of the disease within the body.
Infographic 36: Key Information on Rheumatoid Arthritis (RA)
.PNG)
- This infographic provides information about Rheumatoid Arthritis (RA), stating that approximately 70% of people living with RA are women, and 55% are over 55 years old.
- It outlines common joint-related signs of RA, including tingling in hands and feet, redness of joints, symmetrical joint swelling, and pain in the big toe.
- The infographic also highlights potential systemic affections such as disrupted sleep, depression and mood changes, low-grade fever, and dry eyes and mouth.
- It emphasizes the importance of a balanced diet and moderate exercise for RA patients while cautioning against excessive alcohol consumption.
- The infographic highlights a study that showed a 54% higher mortality risk in people with RA compared to those without the condition.
Infographic 37: Stages of Rheumatoid Arthritis Progression and Lifestyle Tips

- This infographic describes Rheumatoid Arthritis (RA) as a chronic autoimmune disorder affecting the joints of the body.
- It outlines four stages of RA progression, starting with inflammation of the joint lining and progressing to potential cartilage damage, increased pain and swelling, and ultimately, loss of joint function.
- The infographic emphasizes the importance of a healthy lifestyle, including maintaining a balanced diet and engaging in regular, moderate exercise.
- It also advises against drinking alcohol while taking RA medications without consulting a doctor and highlights that smoking is a trigger for RA and should be avoided.
Infographic 38: Rheumatoid Arthritis Warning Signs and Health Effects

- This infographic states that globally, 18 million people are currently living with Rheumatoid Arthritis (RA), with this number projected to increase in the future.
- It highlights common warning signs of RA, including symmetrical symptoms affecting both sides of the body, swelling and pain in the wrists, hands, and finger joints, swelling affecting three or more joints, and morning stiffness lasting longer than 30 minutes.
- The infographic also mentions potential health effects of RA, such as the development of small lumps under the skin and eye problems like sensitivity to light and difficulty seeing clearly.
Infographic 39: Rheumatoid Arthritis Diagnosis and Systemic Effects

- This infographic describes Rheumatoid Arthritis (RA) as a chronic autoimmune disorder that primarily affects joints, leading to inflammation, pain, and swelling.
- If left unmanaged, RA can cause significant joint damage and disability.
- Diagnosis typically involves a comprehensive medical history, including details about symptoms and their progression.
- A physical examination is crucial to assess joint function and movement.
- Blood tests are conducted to check for rheumatoid factor, an antibody present in many individuals with RA.
- It's important to note that RA can have systemic effects, increasing the risk of complications like eye problems, skin issues, lung problems, and infections.
Infographic 40: Rheumatoid Arthritis-Understanding Its Impact and Progression

- This infographic provides a concise overview of Rheumatoid Arthritis (RA), highlighting its symmetrical impact on joints, particularly the shoulders, elbows, wrists, hands, knees, and ankles.
- It outlines the four stages of RA progression, from initial immune system attack on joint tissue to potential joint fusion if left untreated.
- The infographic also presents statistics showing that two-thirds of RA patients experience hand and wrist problems, while 90% develop symptoms in their feet and ankles.
- Key symptoms include tender, warm, and swollen joints, as well as joint stiffness, often worsening in the morning.
- The infographic explains that RA is an autoimmune disease, where the body's immune system mistakenly attacks its own cells, causing inflammation.
Infographic 41: Rheumatoid Arthritis Risk Factors and Severity

- This infographic outlines risk factors associated with Rheumatoid Arthritis (RA), noting that 1.3 million people in the US live with the condition.
- Smoking, particularly for those with a genetic predisposition, significantly increases risk.
- While RA typically onsets in adults in their sixties, excess weight also appears to be a contributing factor.
- Biological sex plays a role, with RA being more common in people assigned female at birth, possibly due to hormonal influences.
- Finally, gum disease, due to oral bacteria potentially spreading inflammation to the joints, is highlighted as another risk factor.
- The infographic also mentions that individuals with RA experience varying levels of severity and may benefit from rehabilitation.
Infographic 42: Rheumatoid Arthritis RA Overview Symptoms Causes and Prevalence in the US

- This infographic provides anoverview of Rheumatoid Arthritis (RA), a chronic autoimmune disease affectingprimarily the joints, where the immune system mistakenly attacks its owntissues.
- It notes that 1.3 million adults in the United States have RA.
- Common symptoms include stiff joints (worse in the morning), fatigue, generaldiscomfort, painful swollen joints on both sides of the body, redness, warmth,and tenderness in the joints, as well as accelerated loss of muscle mass.
- Theinfographic highlights that women are more likely to have RA, and its cause isthought to be a combination of genetic, environmental, and hormonal factors.
Infographic 43: Rheumatoid Arthritis RA Symptoms Risk Factors and Daily Management Tips

- This infographic provides information about Rheumatoid Arthritis (RA).
- It explains that RA typically affects joints symmetrically, particularly the elbows, wrists, hands, knees, and ankles.
- Risk factors for developing RA include age, family history (specific genes), being female, and smoking.
- The infographic also offers advice on living with RA, such as learning about the disease and its treatments, communicating effectively with the healthcare team, seeking support for physical and emotional well-being, and using exercises and relaxation techniques to manage pain and stay active.
Infographic 44: Rheumatoid Arthritis RA Foot Ankle Symptoms Risk Factors and Early Diagnosis Importance

- This infographic highlights RheumatoidArthritis (RA), noting that 90% of patients develop symptoms in the foot andankle.
- It identifies risk factors such as specific genes, smoking, and obesity,and emphasizes that the likelihood of developing RA increases with age.
- The infographic stresses the importance of early diagnosis, as themajority ofpeople with untreated RA will develop joint erosion within two years,indicating disease progression.
Infographic 45: Rheumatoid Arthritis RA Diagnosis Process Medical History Imaging and Lab Tests

- This infographic outlines the diagnosis of Rheumatoid Arthritis (RA).
- Emphasizing a combination of methods including gathering medical history about symptoms, onset, and family history, conducting a physical examination to observe joints and look for other signs, utilizing imaging tests like X-rays, MRI, and ultrasound, and employing laboratory tests such as rheumatoid factor (RF) test, anti-cyclic citrullinated peptide antibody (anti-CCP) test, complete blood count, and erythrocyte sedimentation rate.
- The infographic highlights the importance of both clinical evaluation and laboratory/imaging tests for accurate RA diagnosis.
Infographic 46: Rheumatoid Arthritis RA Immune System Effects Gender Risk and Reversibility

- This infographic defines Rheumatoid Arthritis (RA) as a condition where the immune system attacks its own tissues, noting that it affects women three times more often than men.
- RA is a systemic disease that can impact the whole body and organs like the heart, lungs, muscles, cartilage, and ligaments, causing chronic and sometimes severe swelling and pain that can lead to permanent disability.
- The infographic emphasizes that RA is entirely reversible until joint damage and deformation occur, and even after that, it's still reversible, but the deformation is not.
Infographic 47: Rheumatoid Arthritis Overview Causes Symptoms and Early Warning Signs

- This infographic provides a basic overview of Rheumatoid Arthritis (RA), defining it as a systemic autoimmune disease affecting the soft tissues around joints.
- While the exact cause is unknown, it's believed to be a combination of genetic, environmental, or hormonal factors.
- The infographic notes that RA symptoms are typically symmetrical and initially affect smaller joints in the hands, wrists, and knees.
- Common warning signs include swollen joints, joint stiffness in the morning, low-grade fever, and loss of appetite.
Infographic 48: Rheumatoid Arthritis RA Statistics Prevalence Costs and Diagnosis Age

- This infographic presents key statistics about Rheumatoid Arthritis (RA), stating that 41 out of 100,000 people are diagnosed with RA annually worldwide, and individuals with RA are twice as likely to experience depression.
- The annual medical cost for RA is approximately $5,763 per patient, rising to $15,000-$20,000 with biologic agent treatment.
- RA is most commonly diagnosed between the ages of 30 and 60, and about 1 in 100 adult Canadians has the condition.
Features of
Rheumatoid Arthritis PowerPoint Infographics
- Fully editable in PowerPoint
- All graphics are in vector format
- Medically Referenced information and data
Specifications
 Slides count:
 Compatible with:Microsoft PowerPoint
 File type:PPTX
 Dimensions:16:9
Files Included
- Non-animated PowerPoint
- Animated PowerPoint File
- Animated PowerPoint with Voice Over
- PDF Documents with presentation script
Elevate Your Work with Our Innovative Slides
Thank you! Your submission has been received!
Oops! Something went wrong while submitting the form.


